Strategy Tester Report
AlpariUK-Demo (Build 225)
| Symbol | USDJPY (US Dollar vs Japanese Yen) | ||||
| Period | 1 Hour (H1) 2009.11.03 02:00 - 2009.11.27 22:00 (2009.11.01 - 2009.11.30) | ||||
| Model | Every tick (the most precise method based on all available least timeframes) | ||||
| Parameters | TakeProfit=50; Lots=0.1; InitialStop=30; TrailingStop=20; | ||||
| Bars in test | 551 | Ticks modelled | 541880 | Modelling quality | n/a |
| Mismatched charts errors | 113 | ||||
| Initial deposit | 10000.00 | ||||
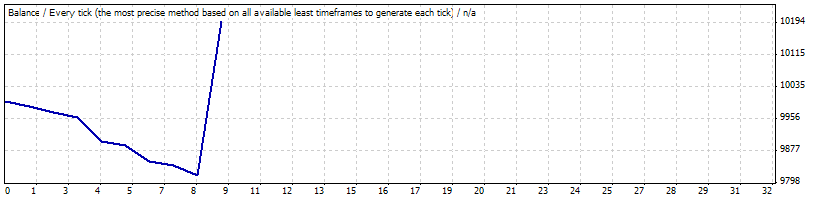
| Total net profit | 197.64 | Gross profit | 380.50 | Gross loss | -182.86 |
| Profit factor | 2.08 | Expected payoff | 21.96 | ||
| Absolute drawdown | 197.09 | Maximal drawdown | 268.32 (2.58%) | Relative drawdown | 2.58% (268.32) |
| Total trades | 9 | Short positions (won %) | 7 (14.29%) | Long positions (won %) | 2 (0.00%) |
| Profit trades (% of total) | 1 (11.11%) | Loss trades (% of total) | 8 (88.89%) | ||
| Largest | profit trade | 380.50 | loss trade | -60.29 | |
| Average | profit trade | 380.50 | loss trade | -22.86 | |
| Maximum | consecutive wins (profit in money) | 1 (380.50) | consecutive losses (loss in money) | 8 (-182.86) | |
| Maximal | consecutive profit (count of wins) | 380.50 (1) | consecutive loss (count of losses) | -182.86 (8) | |
| Average | consecutive wins | 1 | consecutive losses | 8 | |
| # | Time | Type | Order | Size | Price | S / L | T / P | Profit | Balance |
| 1 | 2009.11.03 09:00 | sell | 1 | 0.10 | 90.057 | 0.000 | 0.000 | ||
| 2 | 2009.11.03 12:00 | close | 1 | 0.10 | 90.182 | 0.000 | 0.000 | -13.86 | 9986.14 |
| 3 | 2009.11.03 13:00 | sell | 2 | 0.10 | 90.058 | 0.000 | 0.000 | ||
| 4 | 2009.11.03 14:00 | close | 2 | 0.10 | 90.190 | 0.000 | 0.000 | -14.64 | 9971.50 |
| 5 | 2009.11.04 02:00 | sell | 3 | 0.10 | 90.119 | 0.000 | 0.000 | ||
| 6 | 2009.11.04 03:00 | close | 3 | 0.10 | 90.217 | 0.000 | 0.000 | -10.86 | 9960.64 |
| 7 | 2009.11.04 11:00 | buy | 4 | 0.10 | 90.954 | 0.000 | 0.000 | ||
| 8 | 2009.11.05 05:00 | close | 4 | 0.10 | 90.408 | 0.000 | 0.000 | -60.29 | 9900.35 |
| 9 | 2009.11.05 10:00 | sell | 5 | 0.10 | 90.112 | 0.000 | 0.000 | ||
| 10 | 2009.11.05 11:00 | close | 5 | 0.10 | 90.209 | 0.000 | 0.000 | -10.75 | 9889.60 |
| 11 | 2009.11.05 21:00 | buy | 6 | 0.10 | 90.793 | 0.000 | 0.000 | ||
| 12 | 2009.11.06 09:00 | close | 6 | 0.10 | 90.447 | 0.000 | 0.000 | -38.22 | 9851.38 |
| 13 | 2009.11.06 15:00 | sell | 7 | 0.10 | 90.120 | 0.000 | 0.000 | ||
| 14 | 2009.11.09 04:00 | close | 7 | 0.10 | 90.212 | 0.000 | 0.000 | -10.28 | 9841.10 |
| 15 | 2009.11.09 06:00 | sell | 8 | 0.10 | 90.102 | 0.000 | 0.000 | ||
| 16 | 2009.11.12 16:00 | close | 8 | 0.10 | 90.315 | 0.000 | 0.000 | -23.97 | 9817.14 |
| 17 | 2009.11.13 11:00 | sell | 9 | 0.10 | 89.782 | 0.000 | 0.000 | ||
| 18 | 2009.11.27 22:59 | close at stop | 9 | 0.10 | 86.482 | 0.000 | 0.000 | 380.50 | 10197.64 |